
Search for the average pension pot of someone aged 35 to 44 in the UK and most pages will hand you £39,500. The figure is real, and it comes from the Office for National Statistics. Almost none of those pages mention that the same ONS table carries a second figure for that age group, in the next column: £19,000.
Both are correct. They count different people.
That gap is the first of three measuring decisions underneath the “average pension pot by age” tables that circulate online. The ONS makes all three openly, and the pages copying its figures tend to drop them.
The numbers the ONS publishes
The figures below come from Table 6.10 of the ONS Pension wealth: wealth in Great Britain dataset, covering April 2020 to March 2022 and published on 24 January 2025. They are medians for Great Britain, men and women combined.
| Age | Median among those with private pension wealth | Median across everyone in the age group | Share with any private pension wealth |
|---|---|---|---|
| 16 to 24 | £5,500 | £0 | 27% |
| 25 to 34 | £18,800 | £6,000 | 70% |
| 35 to 44 | £39,500 | £19,000 | 75% |
| 45 to 54 | £80,000 | £41,200 | 79% |
| 55 to 64 | £137,800 | £86,800 | 79% |
| 65 to 74 | £145,900 | £68,500 | 71% |
| 75 and over | £59,700 | £27,400 | 69% |
| All adults | £57,500 | £19,700 | 70% |
The ONS spells out the difference in its own footnotes. The first column “excludes individuals with zero private pension wealth”. The second “includes everyone regardless of whether they have private pension wealth or not”.
So the first column describes savers and the second describes the population. At 45 to 54 the two differ by £38,800, because roughly a fifth of that age group has no private pension at all and their zeros drag the middle of the distribution down.
The first column is the one that circulates, and it is the higher of the two. A reader with no pension who compares against it looks further behind than they are, because everyone in their position has already been removed from the comparison.
Two cautions come attached to these figures. The Wealth and Assets Survey had its accreditation suspended from Round 8 onwards on 13 June 2025 while the ONS works on quality, so these are no longer accredited official statistics. And the ONS changed how it estimates private pension wealth for this round, stating in the workbook that the April 2020 to March 2022 figures “are not comparable with estimates from previous rounds/waves”. The apparent dip at 65 to 74 against the previous round comes from that methodology change.
Per pot or per person
The second measuring decision sits in the word everybody uses.
The ONS defines private pension wealth as “the value of any pension pots already accrued that are not state basic retirement or state earning-related”, including “occupational pensions, personal pensions, retained rights in previous pensions and pensions in payment”. That is a total for one person across everything they hold: active schemes, preserved ones from jobs left years ago, and pensions already paying out.
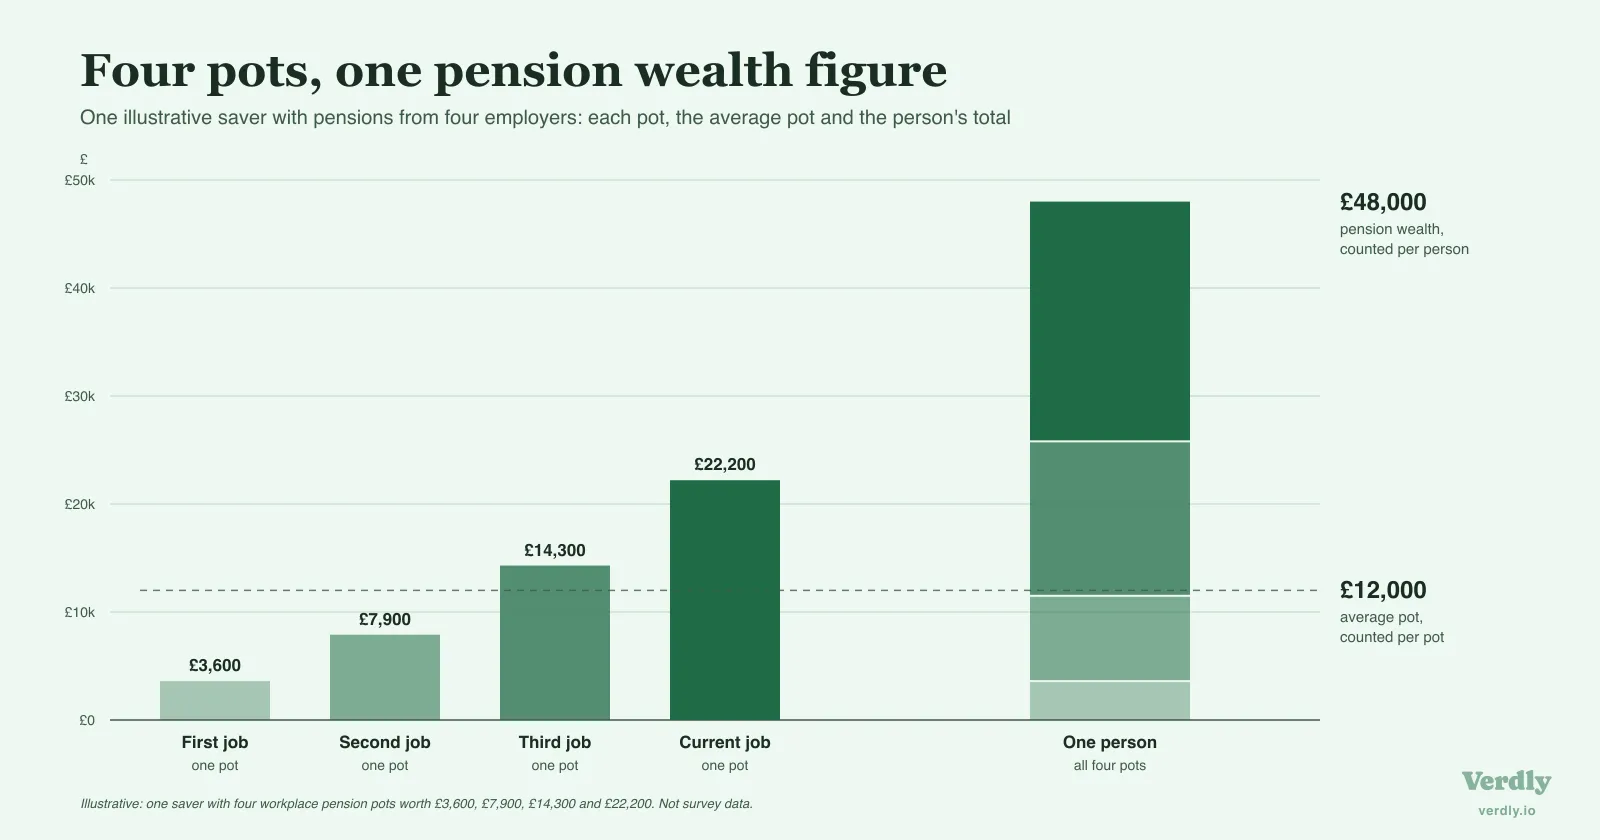
A provider’s “average pot” figure describes one arrangement at one company. Somebody who has had four employers has four pots and one pension wealth figure, and only the second is comparable to the table above.
Pots also get lost. The Pensions Policy Institute’s Lost Pensions 2024 research estimated 3.3 million lost pension pots in the UK holding £31.1 billion between them, averaging £9,470 a pot and £13,620 among people aged 55 to 75. Owners lose track of them after moving house, changing name or leaving the job that set them up.
So a per-pot average understates what people have accrued, and a reader adding up their own pensions can miss whatever sits in a forgotten scheme. The PPI’s Lost Pensions 2026 survey extends the work to defined benefit providers for the first time, so those figures will be restated.
A defined benefit pension has no pot at all
The third decision is the one that distorts individual comparisons most.
A defined contribution pension has a balance. Money goes in, it is invested, and a statement tells you what it is worth today. A defined benefit pension is a promise of an income instead, usually calculated from salary and years of service, so there is no balance to report.
On any pot-based measure, that promise registers as nothing. A nurse or a teacher with a substantial career-average entitlement can appear in a pot table as though they have almost no pension, while somebody with a modest defined contribution balance and nothing else looks ahead of them. The ONS figures avoid this by putting a capitalised value on defined benefit entitlements. That makes them the fairer comparator, and also the harder number to produce. Verdly publishes for education, not financial advice; your circumstances will differ, and a regulated adviser is the right place for decisions specific to you.
If you hold a defined benefit pension and want a defensible figure for your own records, putting a number on a defined benefit pension covers the methods and their limits.
Even the total is contested
Capitalising a future income stream means choosing a discount rate, and that choice moves the answer a long way.
In April 2026 the Institute for Fiscal Studies published a reassessment of how pension wealth is valued by Isaac Delestre and Laurence O’Brien, discounting future pension income at real gilt yields rather than the rate the ONS uses. Using the April 2020 to March 2022 survey data, in 2026 prices, mean household pension wealth came out at £450,000 under the IFS approach against £230,000 under the ONS approach. Roughly double, from the same underlying responses.
The two bodies are making different assumptions about what a future pension income is worth today. For anyone comparing against a published median, that makes the level itself uncertain before any of the distinctions above come into play.
Reading the number you are standing next to
A benchmark is only informative if you know what it measures. Three questions settle that for any pension figure you come across.
Is it per person or per pot? If the source is a pension provider or a platform reporting on its own customers, it is almost certainly per pot, and a reader with several old schemes will look poorer than they are.
Does it include people with no pension? At some ages the first ONS column is more than double the second, and the first is the one usually quoted.
What is the figure window? These figures cover April 2020 to March 2022. That period sits inside the pandemic, when the survey moved to telephone interviewing and the ONS cautions that results carry additional uncertainty. A page badged “2026 statistics” is often showing 2020 to 2022 data under a new date.
The ONS table is also a single reading, from a survey that runs every few years and is currently between releases. Pension balances recorded on the same basis at every snapshot build a series of your own in the years between. That series is what a net worth tracker built for the long view is for: Verdly keeps each snapshot as its own entry, and you can start a record at app.verdly.io whenever the numbers are to hand.
Whether a pension belongs in a net worth total is its own debate, and whether your pension belongs in your net worth sets out both positions. The wider picture of net worth by age covers total household wealth from the same survey, and savings by age covers the money held outside a pension.
What the table does say is specific: at 35 to 44, half of the people who have a private pension hold less than £39,500 in it, and a quarter of that age group hold none. Any pension figure by age is only comparable once you know which of those two groups it describes.